
 By Douglas George, Ph.D.
Coastal Oceanography Group, Bodega Marine Laboratory
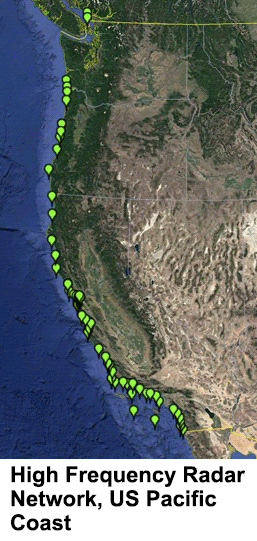
High-frequency radar (HFR) has measured coastal surface currents off California since the late 1990s, with a statewide array in place since 2008. Hourly surface current maps are available with a statewide resolution of about 5 km and with finer spatial resolution of about 1 km in specific regions, such as the Gulf of Farallones. The 72 stations on the West Coast have created a large dataset in space and time we can use to look at ocean climate variability, events, and trends.
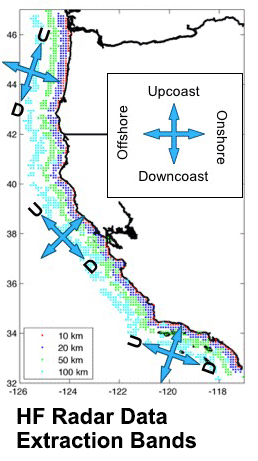
One way to analyze the trove of data from 2008-2018 is to rotate the vectors so they align with the coastline and we can identify alongshore and cross-shore flow patterns. Using weekly averaged data, we extracted rotated data at 20 km-wide bands to create transects of data at different distances from the coastline. For example, to represent the 20 km transect, we use data from 10-30 km whereas for the 50 km transect, we use data from 40-60 km. We can group the weekly data in different ways: by month to look at seasonal patterns, by year to look at annual patterns, or by transect to look at cross-shelf patterns through time.
Monthly Flow Patterns
 The animation below shows alongshore (left) and cross-shore (middle) flow patterns every 10 km from the Columbia River to the California-Mexico border. The blue dots are the mean and the pink cloud is the standard deviation for each month within the data record. For example, January shows data for all 10 Januaries from 2008-2018. Looking at the data in this way allows us to see flow patterns for a typical January and the variability for that month. For the alongshore panel, when points are to the left of the dashed line, flow is upcoast, or generally to the north. When points are to the right of the dashed line, flow is downcoast, or generally to the south. Similarly, for the cross-shore panel, points on the left show onshore flow and on the right, offshore flow.
After watching the video, below, a few times, we can see patterns emerge. The alongshore flow moves generally in same direction along both Oregon and California, although at different speeds throughout the year. For example, in April, all flow is downcoast but it is much faster from San Francisco Bay north than to the south. The ocean seasons of upwelling (March-September), oceanic (October-November), and Davidson (December-March) are easy to identify as the flow cycles between upcoast and downcoast. North of Monterey Bay (~37 degrees), the flow is substantially more variable than south along Big Sur and into the Southern California Bight. The cross-shore flow is generally offshore, with particular enhancement in late spring to mid-summer during upwelling season. It is most variable along southern Oregon and northern California with strong connections to major headlands, such as Cape Mendocino at around 40 degrees latitude.
Animation of alongshore (left) and cross-shore (middle) flow patterns.
Annual Flow Patterns
The image below shows alongshore and cross-shore flow patterns every 10 km from the Columbia River to the California-Mexico border from 2008-2018. The blue dots are the mean and the pink cloud is the standard deviation for all the data in a single year at each 10 km increment. For example, every point in 2008 shows the average flow for 2008 with the variability of that average behind it. We can see flow patterns for each year geographically and compare year-to-year differences. For the alongshore panel, when points are to the left of the dashed line, flow is upcoast, or generally to the north. When points are to the right of the dashed line, flow is downcoast, or generally to the south. Similarly, for the cross-shore panel, points on the left show onshore flow and on the right, offshore flow.
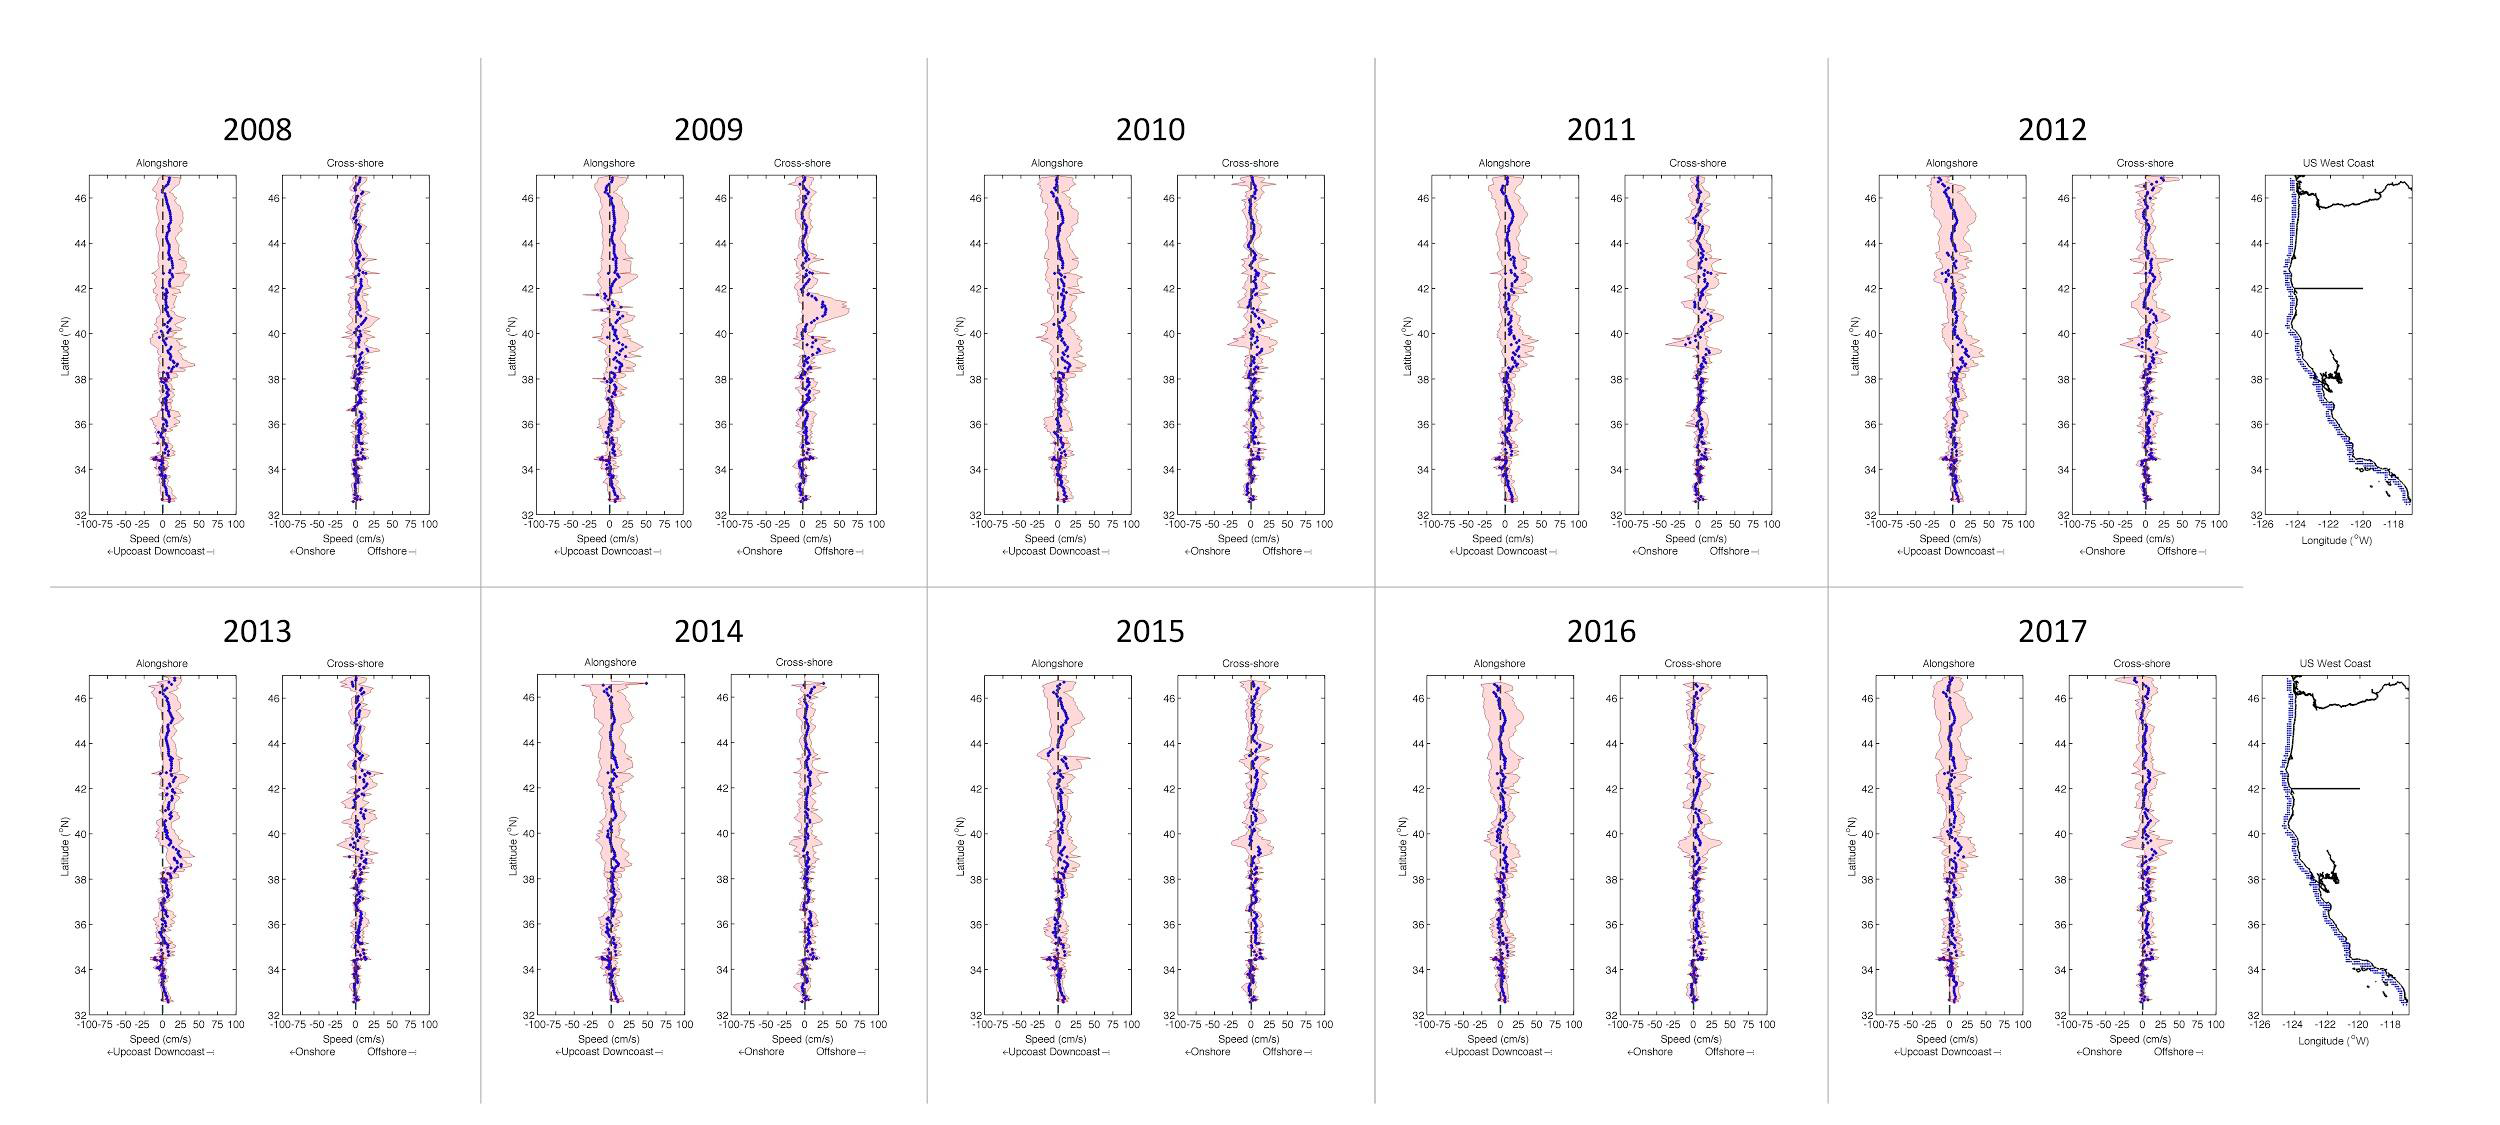
Throughout the years, alongshore currents oscillate around a net downcoast (southward) flow with areas of local occasional enhancement. The amount of shifting between the upcoast and downcoast flows varies considerably with some years (e.g., 2010, 2012, and 2014) showing wide swings whereas other years (e.g., 2008 and 2013) showing much narrower ranges. Geographically, the most variability is seen north of the San Francisco Bay region with smaller oscillations between upcoast and downcoast flows in the Southern California Bight, although near Point Conception, there is localized enhancement. The most similar years in the northern portion of the region are 2010-2014-2016-2017, 2008-2011-2013, and 2009-2015, with 2012 showing characteristics of many years. The cross-shore flows patterns are less definitive except for the Cape Mendocino area of northern California. At this location, onshore and offshore flows oscillate substantially and consistently throughout the years indicating this area is a zone of constant fluctuation. The strongest signal in this area is seen in 2009 with lesser but still strong signals in 2010, 2015, 2016, and 2017. These annual comparisons are a first look at how the ocean currents behaved during several Pacific Ocean-basin wide events such as the 2009-2010 and 2015-2016 El Nino-Southern Oscillation (ENSO) events, the 2011 La Nina event, and the 2014-2015 marine heatwave, also called the Warm Blob.
Cross-Shelf Variability
The next two plots show time along the bottom and velocity of either alongshore or cross-shore currents at seven different latitudes. The colors of the lines represent different distances from shore – 10 km (red), 20 km (blue), 50 km (green) and 100 km (cyan).
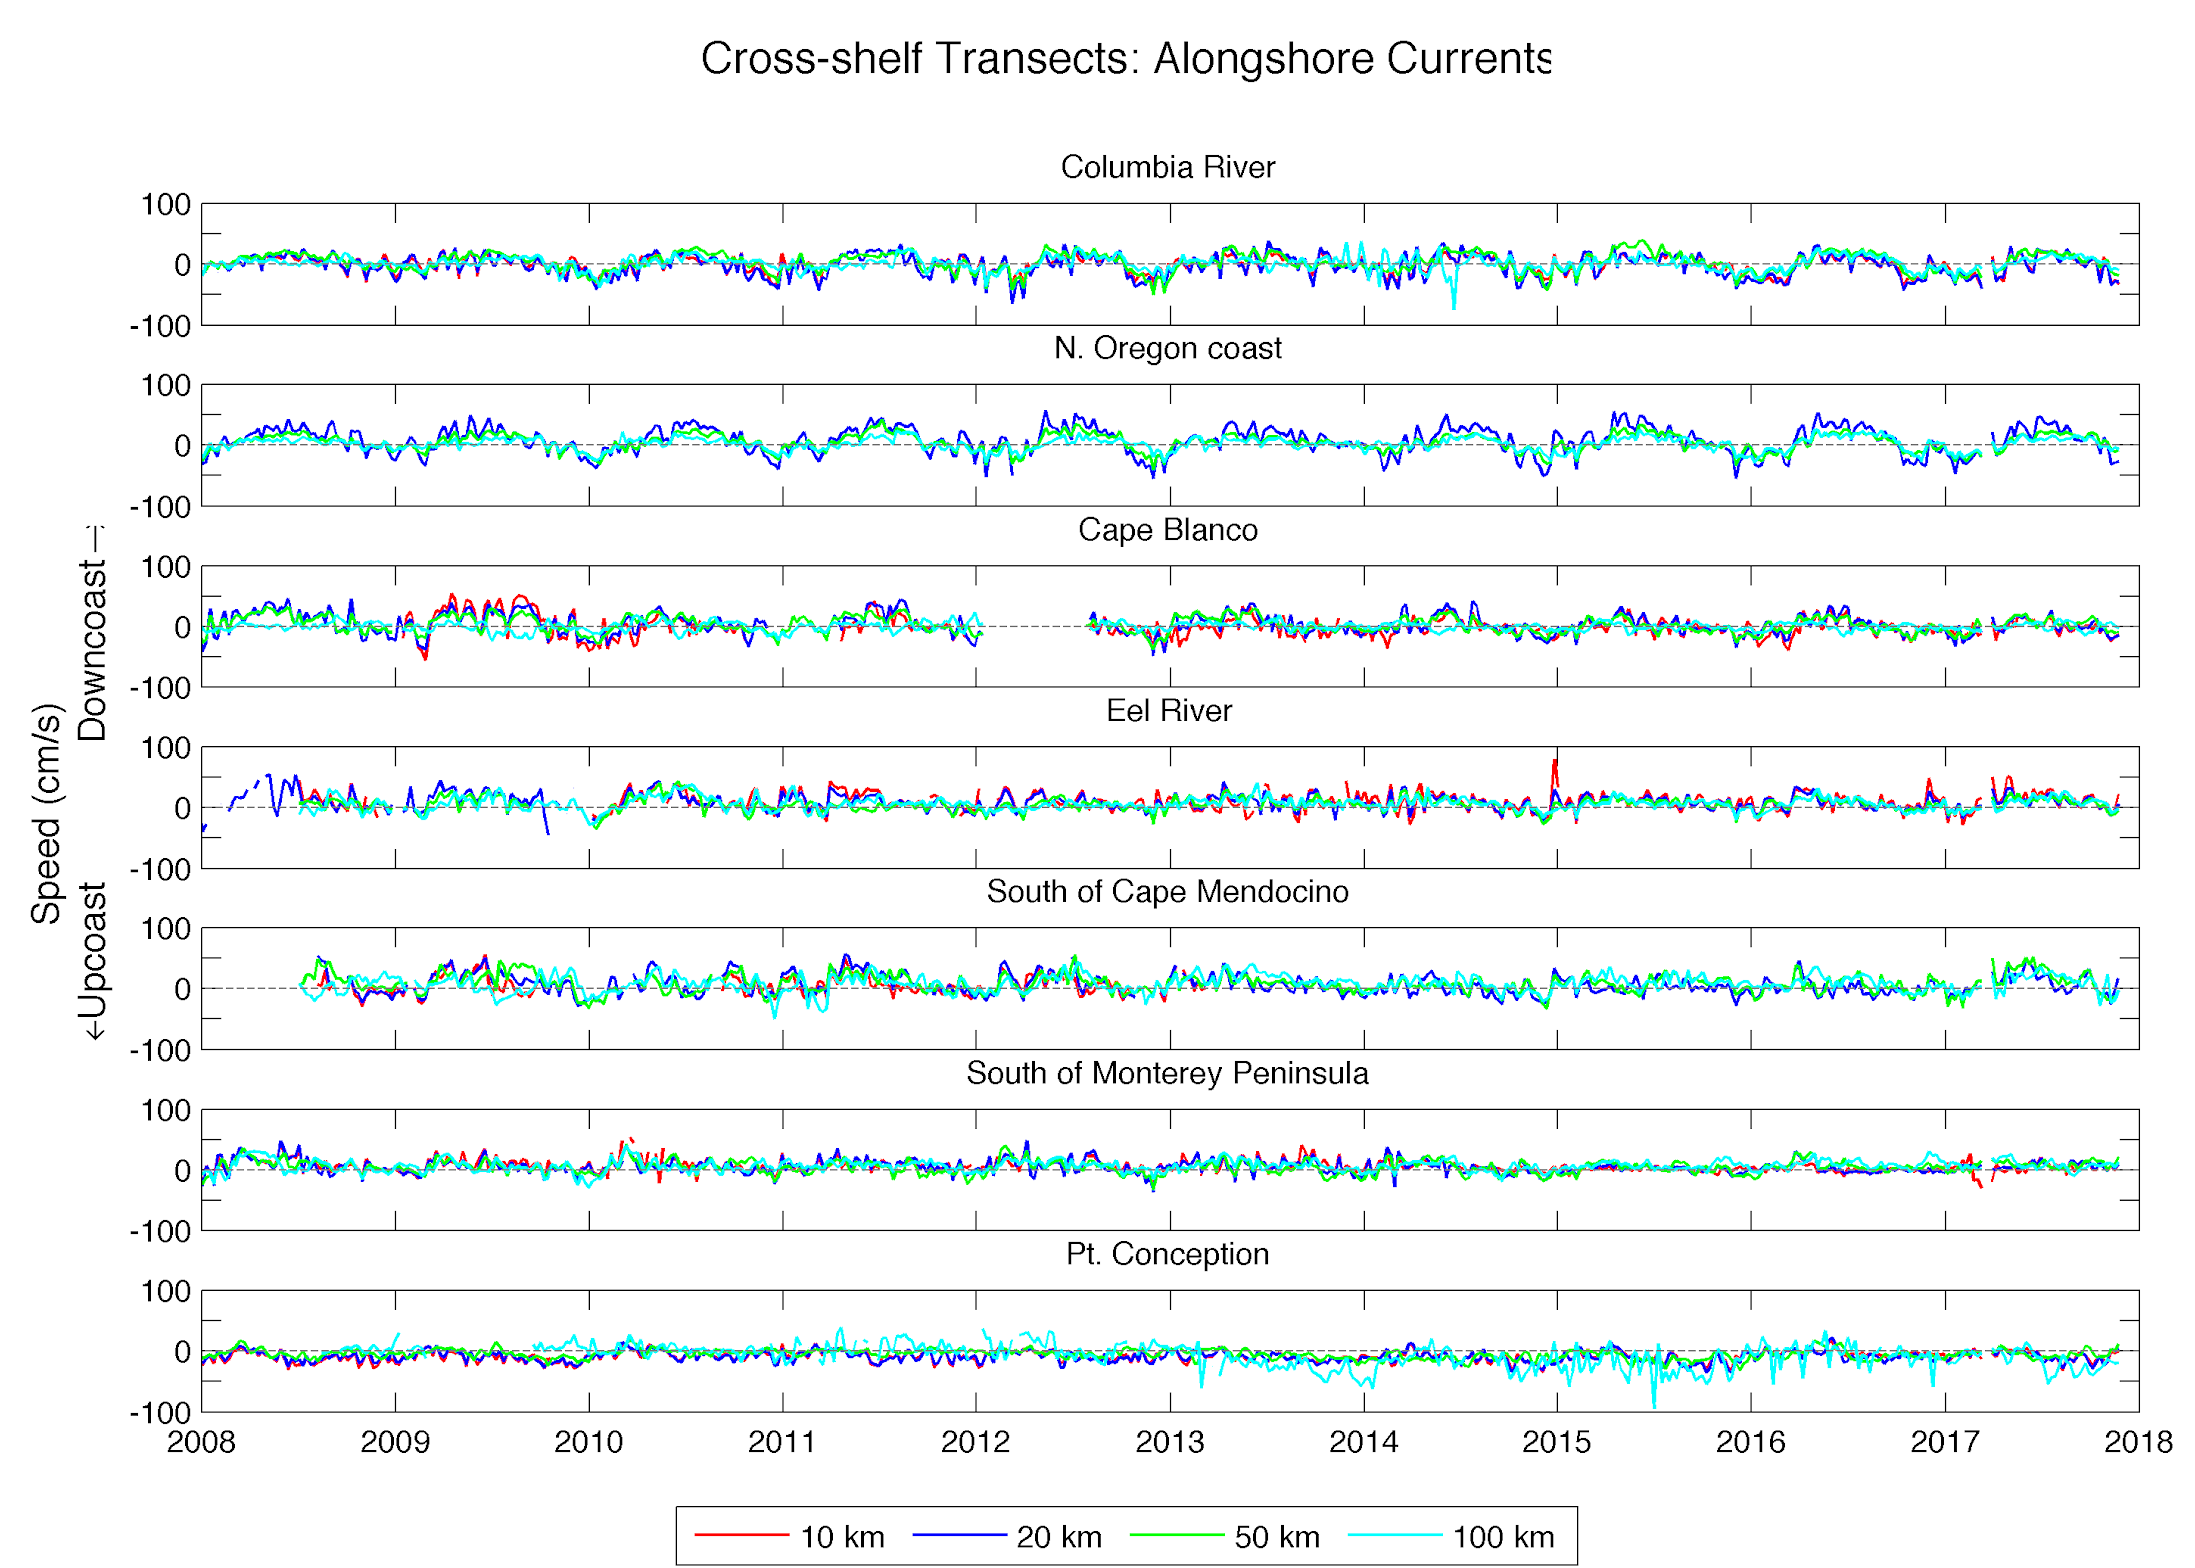
Several patterns through geography and time can be seen in the alongshore cross-shelf plots. In the northern transects, the seasonal shift described in the monthly animation is very consistent across the shelf with very little differences among the four distances from shore. This pattern begins to change at Cape Blanco and the Eel River transects where differences between the 20 km and 50 km distances emerge. By Cape Mendocino, the seasonality signal is more complicated across the shelf and further south, the offshore region and inshore regions show much less connection.
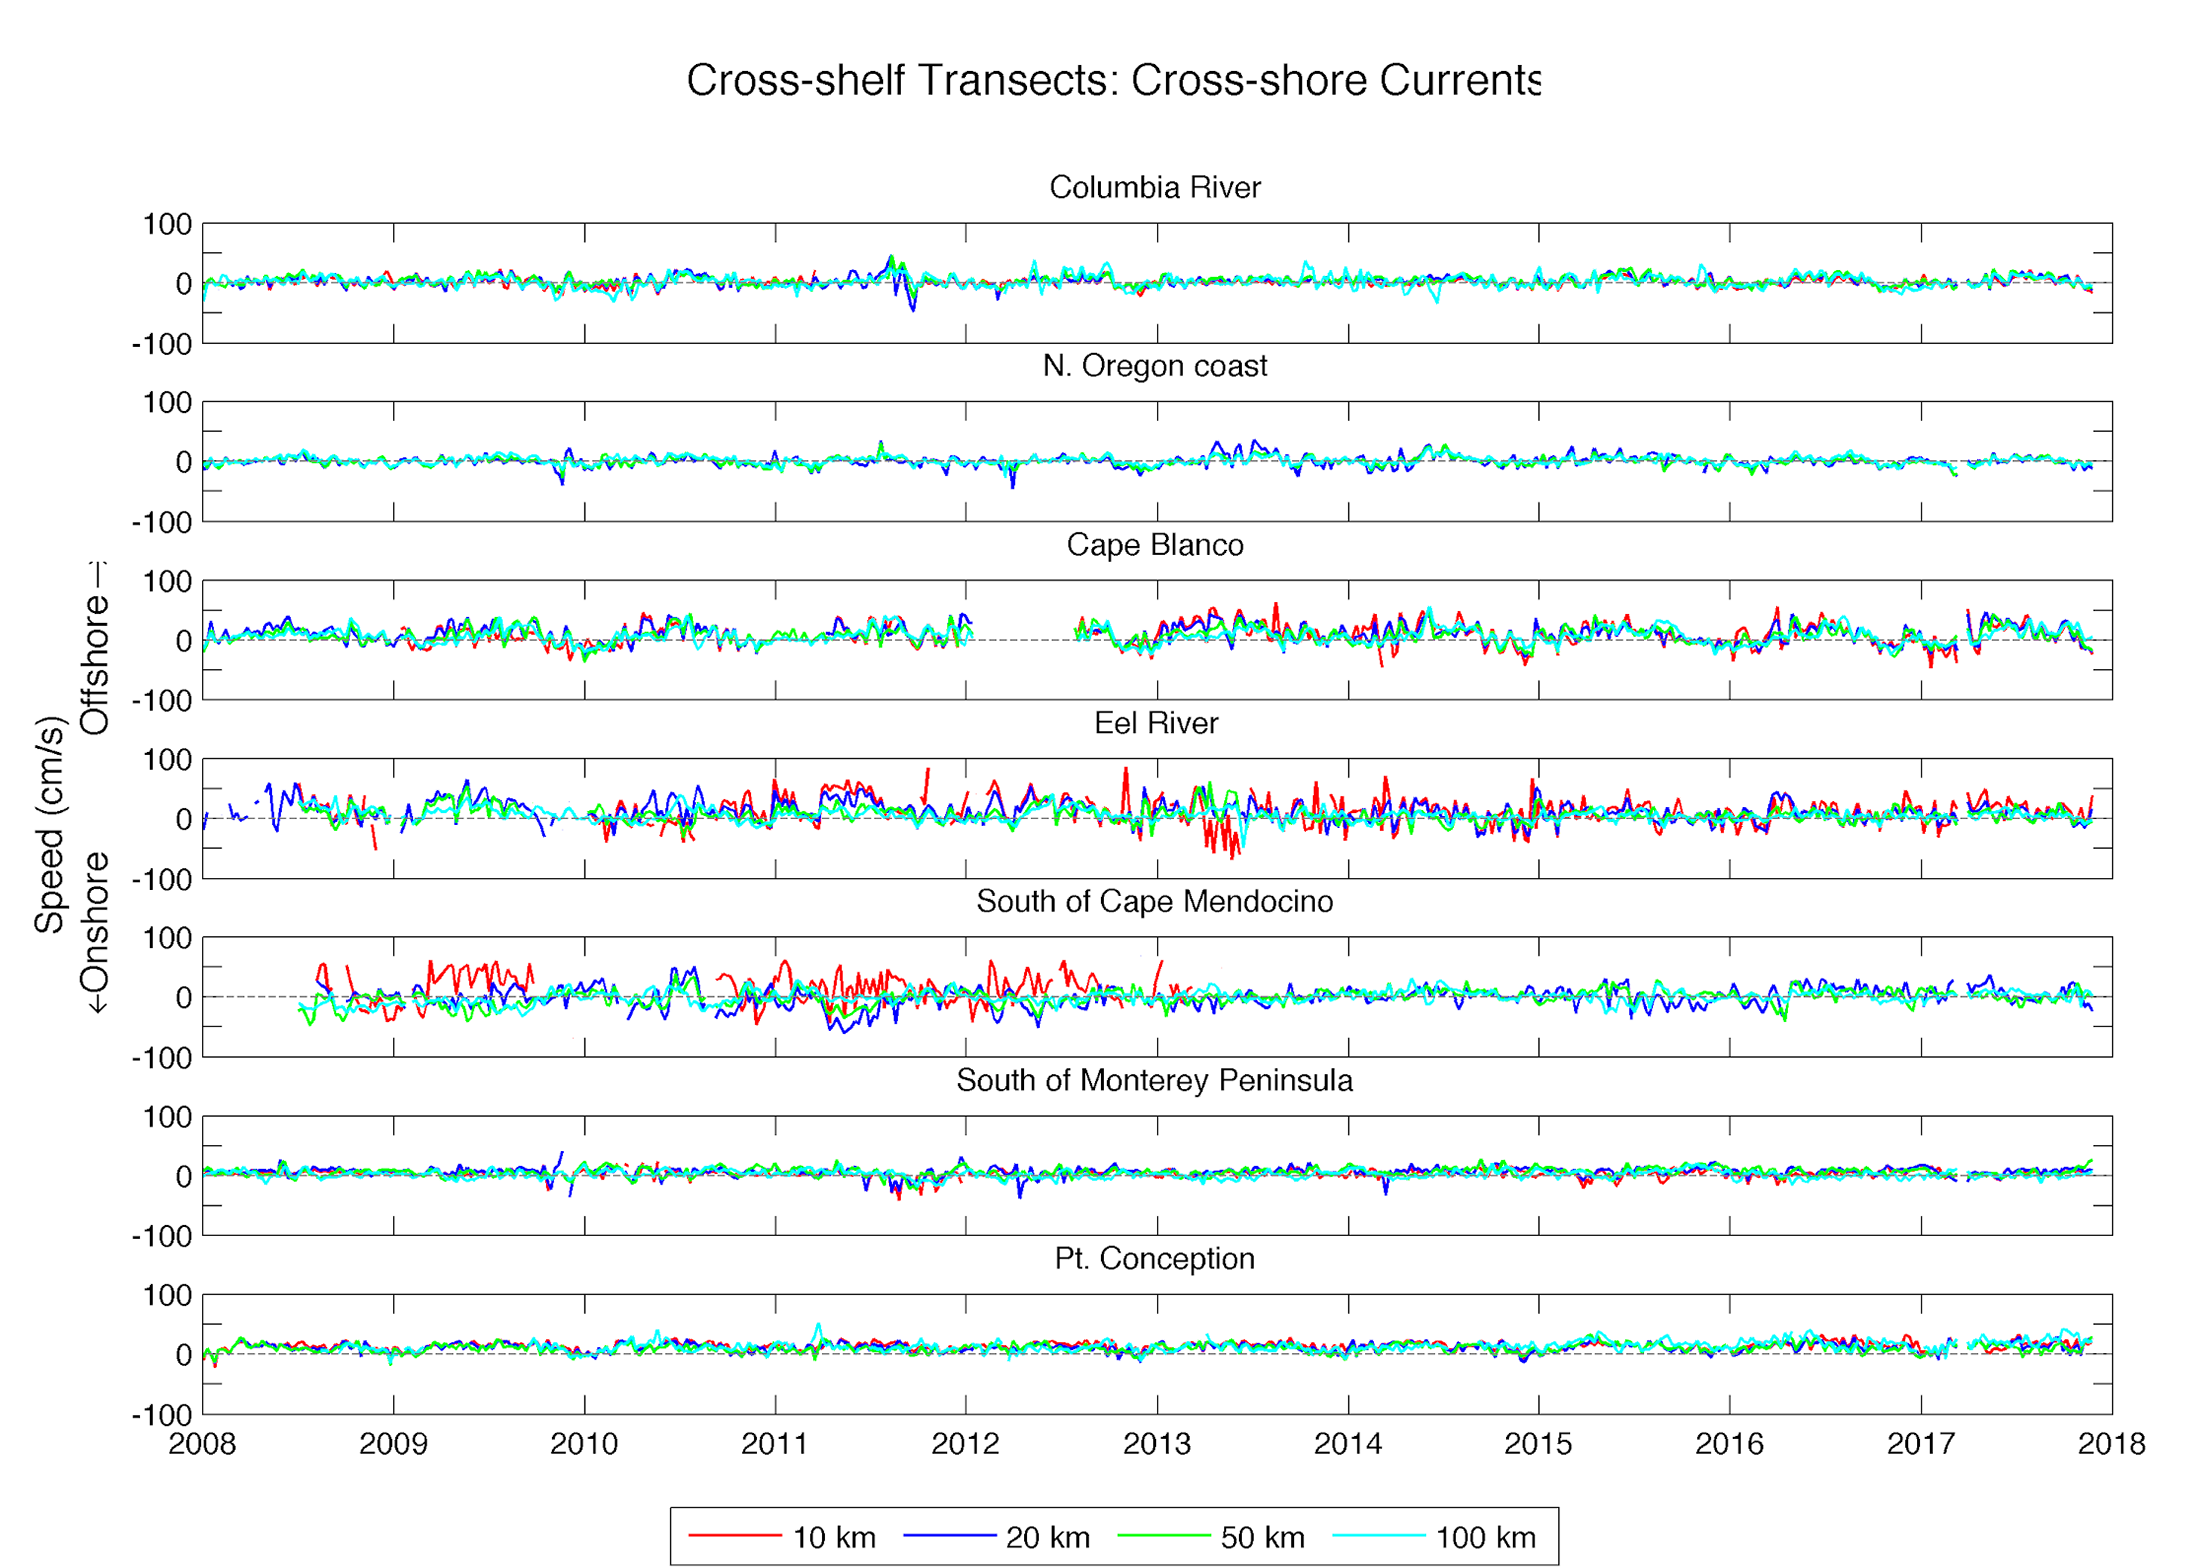
The story for the cross-shore cross-shelf flow is very different. For four of the seven transects, the onshore-offshore signal is fairly consistent and not fast (less than 50 cm/s). However, in the southern Oregon/northern California zone (three middle transects), extremely variable and fast currents dominate throughout the whole decade. The Eel River transect shows the most noticeable inshore and offshore differences as well as high velocities covering 2010-2015. The south of Cape Mendocino transect has very active cross-shore currents from 2008-2013 and then much less active flows. Some of these changes could relate to the basin-wide events mentioned above, such as the marine heat wave and the ENSO cycles.
Future Work
The large dataset of surface currents spanning a decade along the West Coast of North America is rich with patterns through geography and time. We are just at the beginning of deeper analysis using statistical relationships, association with climate events, and characterization of trends. Once these analyses are completed, connections to marine biological and ocean chemistry observations, such as plankton distribution or pH levels, can be explored to link physical processes to other components of our ocean environment.
Acknowledgements
John Largier supported this analysis through many in-depth discussions and through a post-doctoral award. Marcel Losekoot conducted the initial data compilation from the unwieldy dataset.
Sea surface current data for 10 years (2008-2017) were explored by looking at alongshore and cross-shore transport on monthly and annual timeframes. Authors: D.A. George and J.L. Largier, presented at Ocean Sciences 2018, Portland, OR. Abstract here.
For more details, please see
Ocean Sciences 2018 Presentation
Poster "Sea Surface Current Measurements: What They Are and Why You Need Them" An overview of how sea surface current data can be acquired and applied to many coastal science and management questions. Authors: M. Losekoot, D. Shideler, D. George, and J. Largier, presented at California Shore and Beach Preservation Association Coastal Conditions Conference 2018, Bodega Bay, CA.