
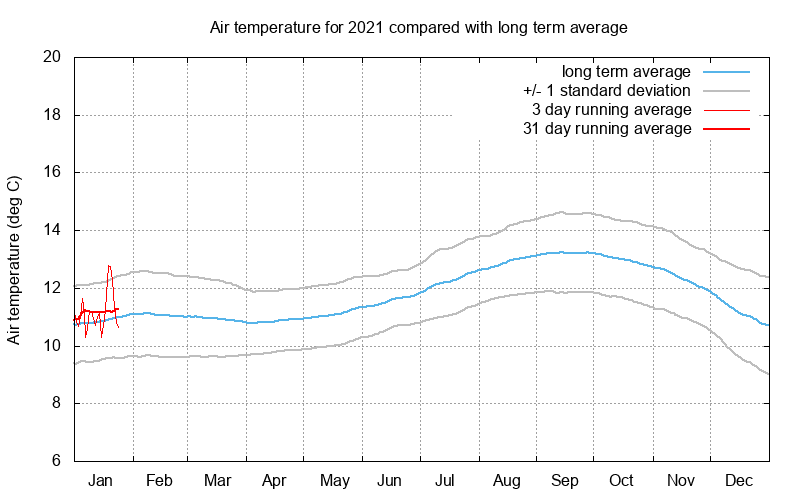
Air Temperature compared with long term average
The air temperature at the sea surface is affected by both the sun and the seawater temperature. From March to August, air temperature drops due to the presence of cooler seawater, brought to the surface through upwelling caused by seasonal winds.
This graph shows the long term average temperature (in blue) for each day of the year and the spread of one standard deviation (in gray) calculated from the actual temperatures recorded from 1982 to present. The red lines represent the average values for the current year.
Air, wind, and seawater temperature data used in the climatology charts are measured at NOAA NDBC buoy 46013.
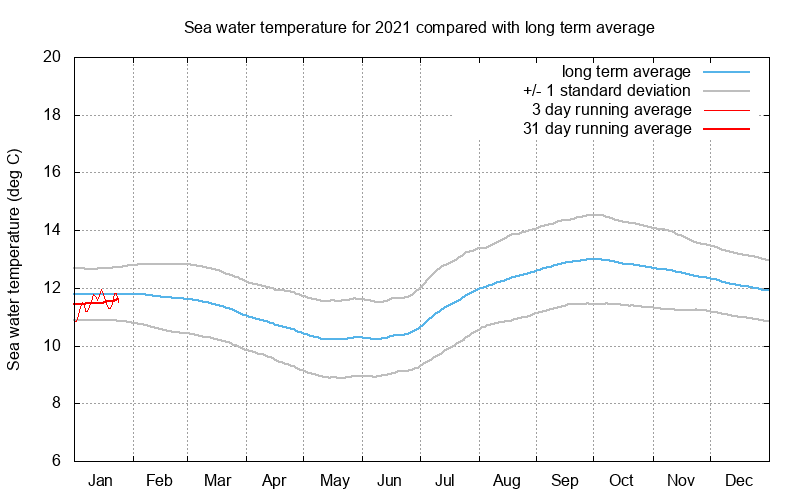
Seawater Temperature compared with long term average
Seawater temperature varies by several degrees throughout the year. Generally the summer sun warms the water, but seasonal winds bring cooler waters to the surface through upwelling, causing the dip from March to August.
This graph shows the long term average temperature (in blue) for each day of the year and the spread of one standard deviation (in gray) calculated from the actual temperatures recorded from 1982 to present. The red lines represent the average values for the current year.
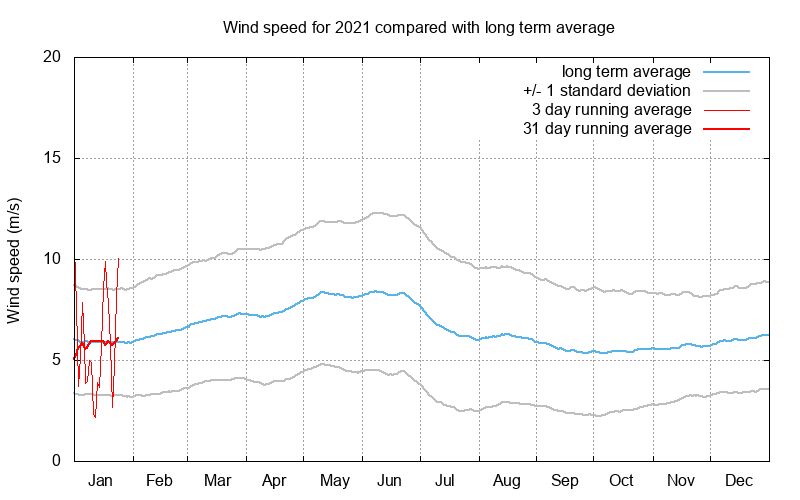
Wind Speed compared with long term average
The wind speed at the sea surface varies with the seasons and is typically strongest from March to August, causing the surface seawater to flow offshore, in turn bringing cooler deep water to the surface in a process called upwelling.
This graph shows the long term average wind speed (in blue) for each day of the year and the spread of one standard deviation (in gray) calculated from the actual wind speeds recorded from 1982 to present. The red lines represent the average values for the current year.
For plots of data from previous years since 1981, please see the Climatology Data Downloads page.